Inside Collaborative Fund’s 4x DPI Fund I
A breakdown of a top-decile fund.
Lately, it feels like every corner of my internet bubble is talking about venture returns—Carta charts one day, leaked DPI tables the next. I’ve seen posts on lagging vintages, mega-fund bloat, the “Venture Arrogance Score”, the rising bar for 99th‑percentile exits, and the PE-ification of VC.
But for all that noise, I haven’t seen much that actually walks through how returns metrics evolve over time in an early-stage fund. That’s a crucial gap. Many analyses focus on funds that are still mid-vintage, where paper markups can tell an incomplete or even misleading story.
So I pulled the numbers on Collaborative’s first fund, a 2011 vintage that’s now nearly fully realized. It offers a concrete look at how venture performance can unfold across a fund’s full lifecycle.
Fund 1 was small: $8M deployed across 50 investments. Check sizes ranged from ~$10K to ~$400K, averaging around $100K for both initial and follow-on rounds. It was US-focused, sector-agnostic, and mostly pre-seed through Series A.
Portfolio metrics
Without further ado, here’s how the fund performed over its lifetime across a few core metrics:
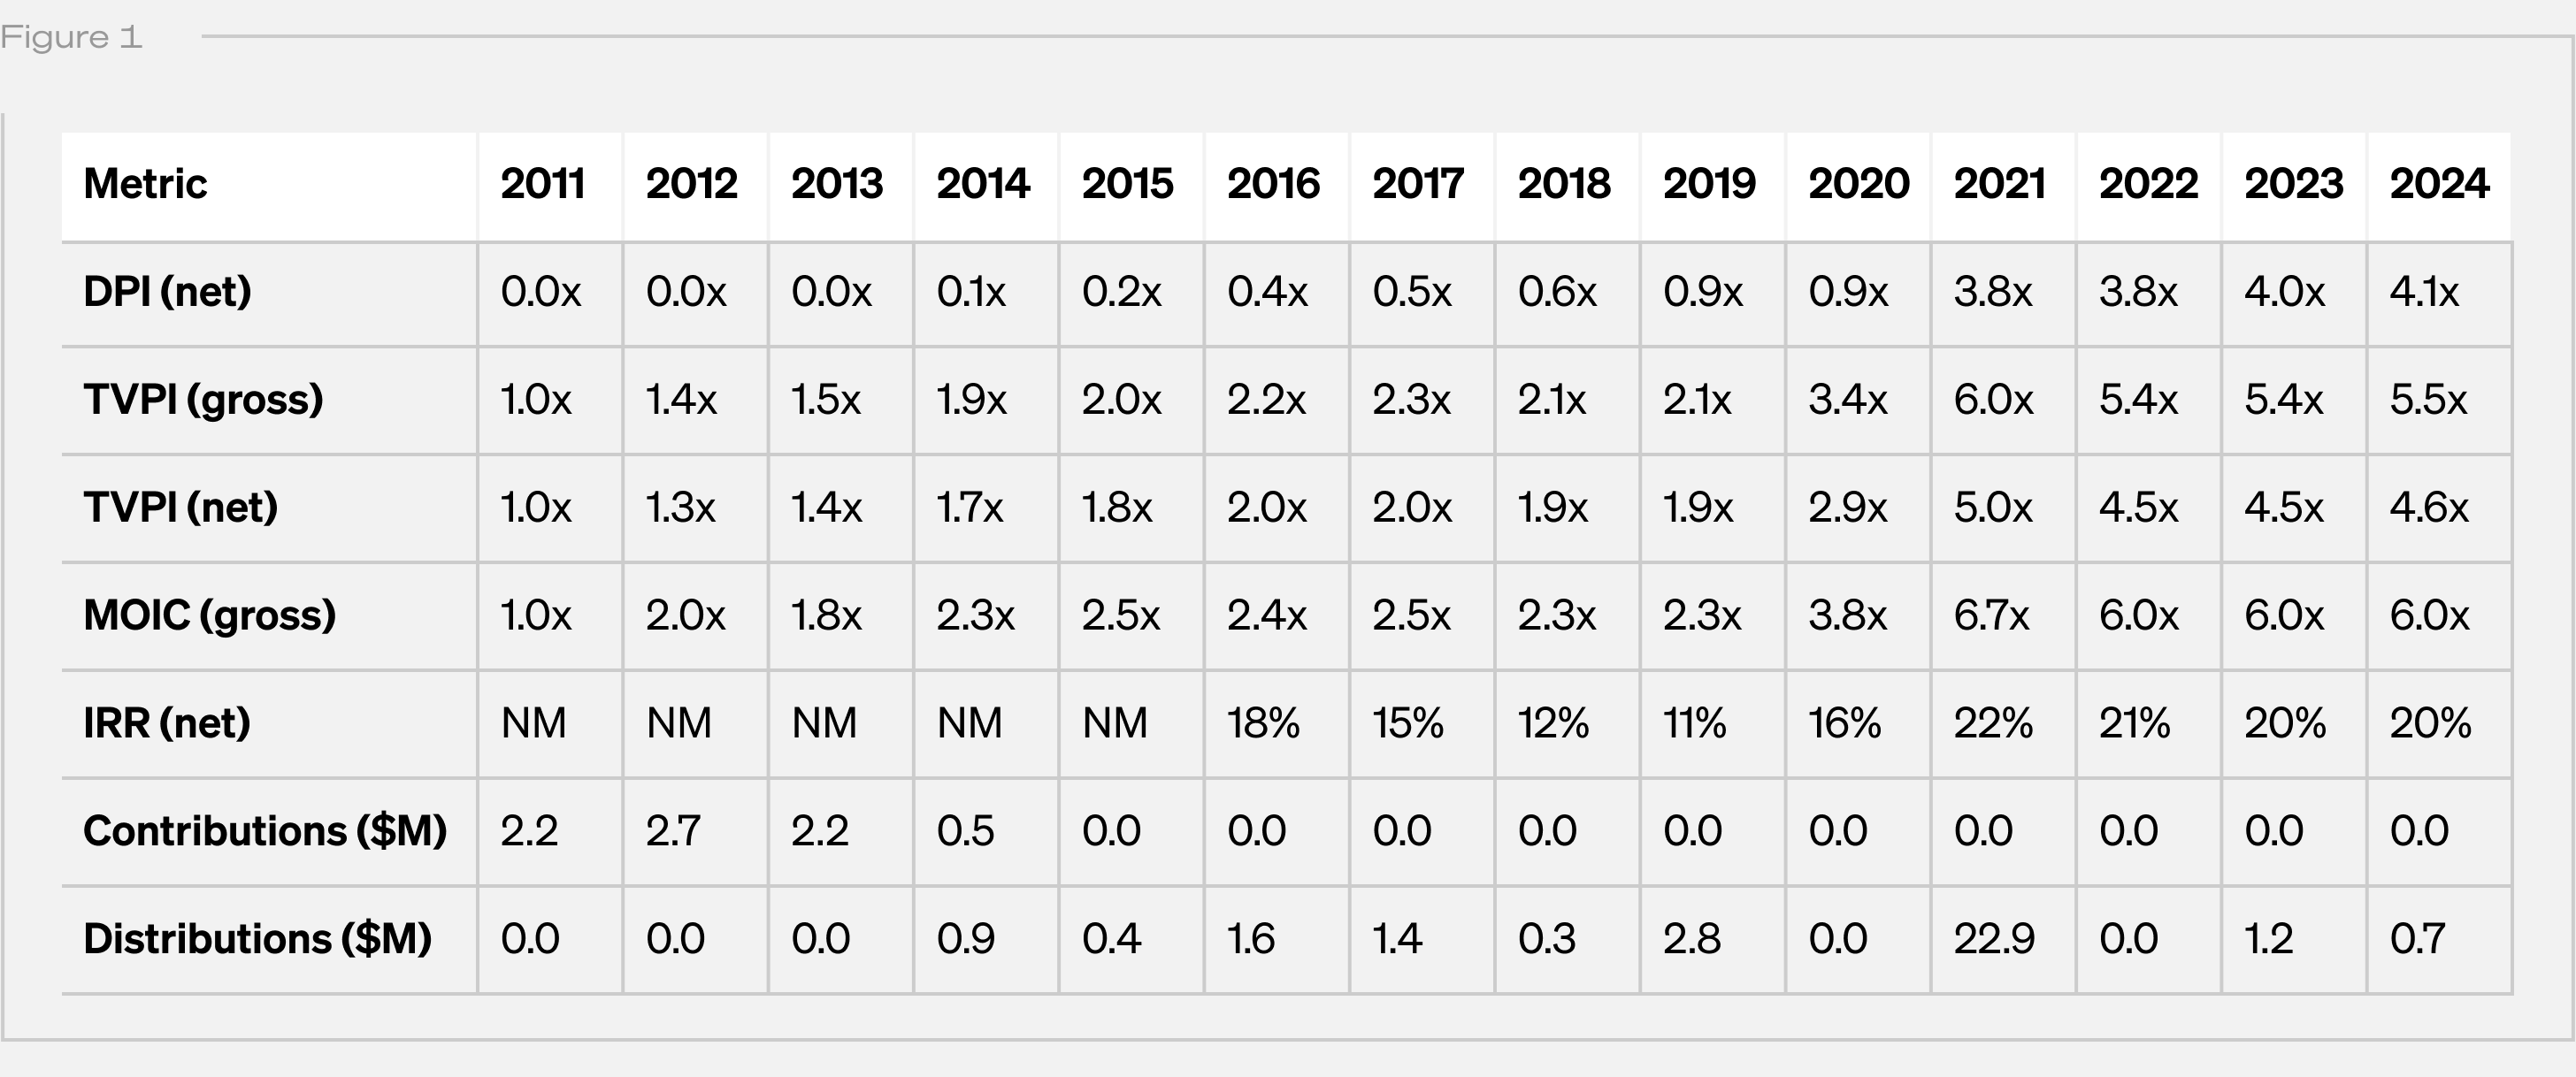
Note: Distributions are net to LPs; contributions reflect paid-in capital. IRR data was not meaningful (“NM”) for years 1–5.
Below is a line chart of the returns data:
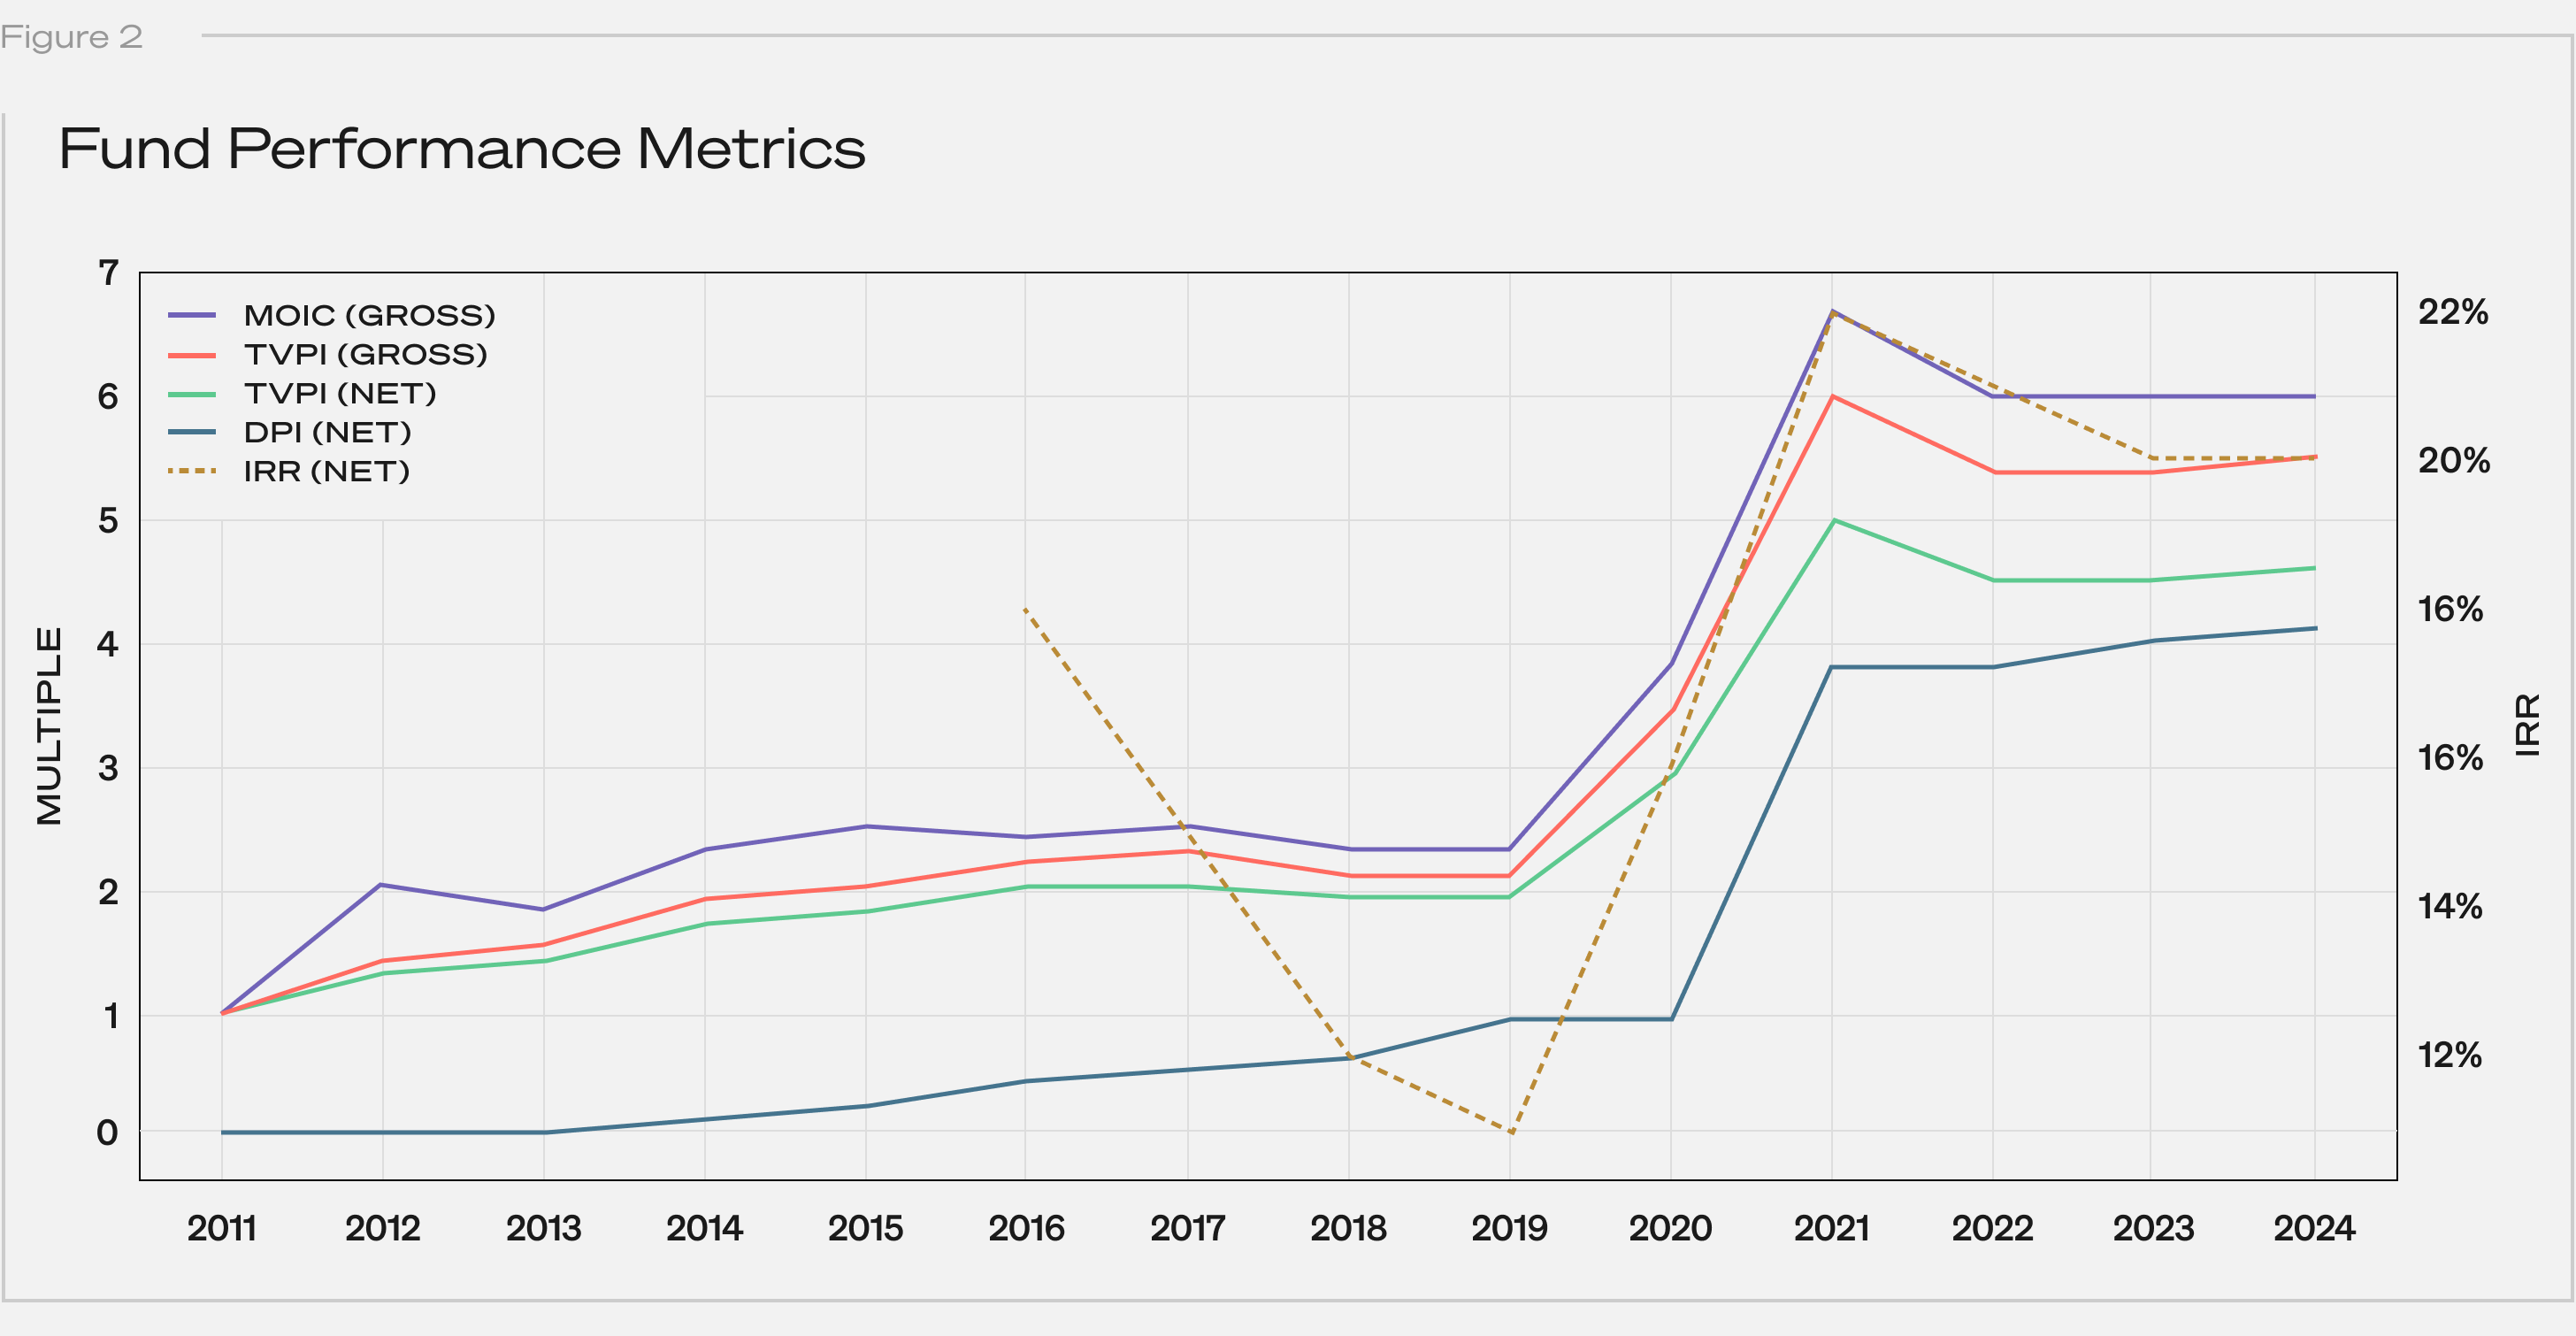
Note: IRR is shown as a dashed line corresponding to the secondary axis.
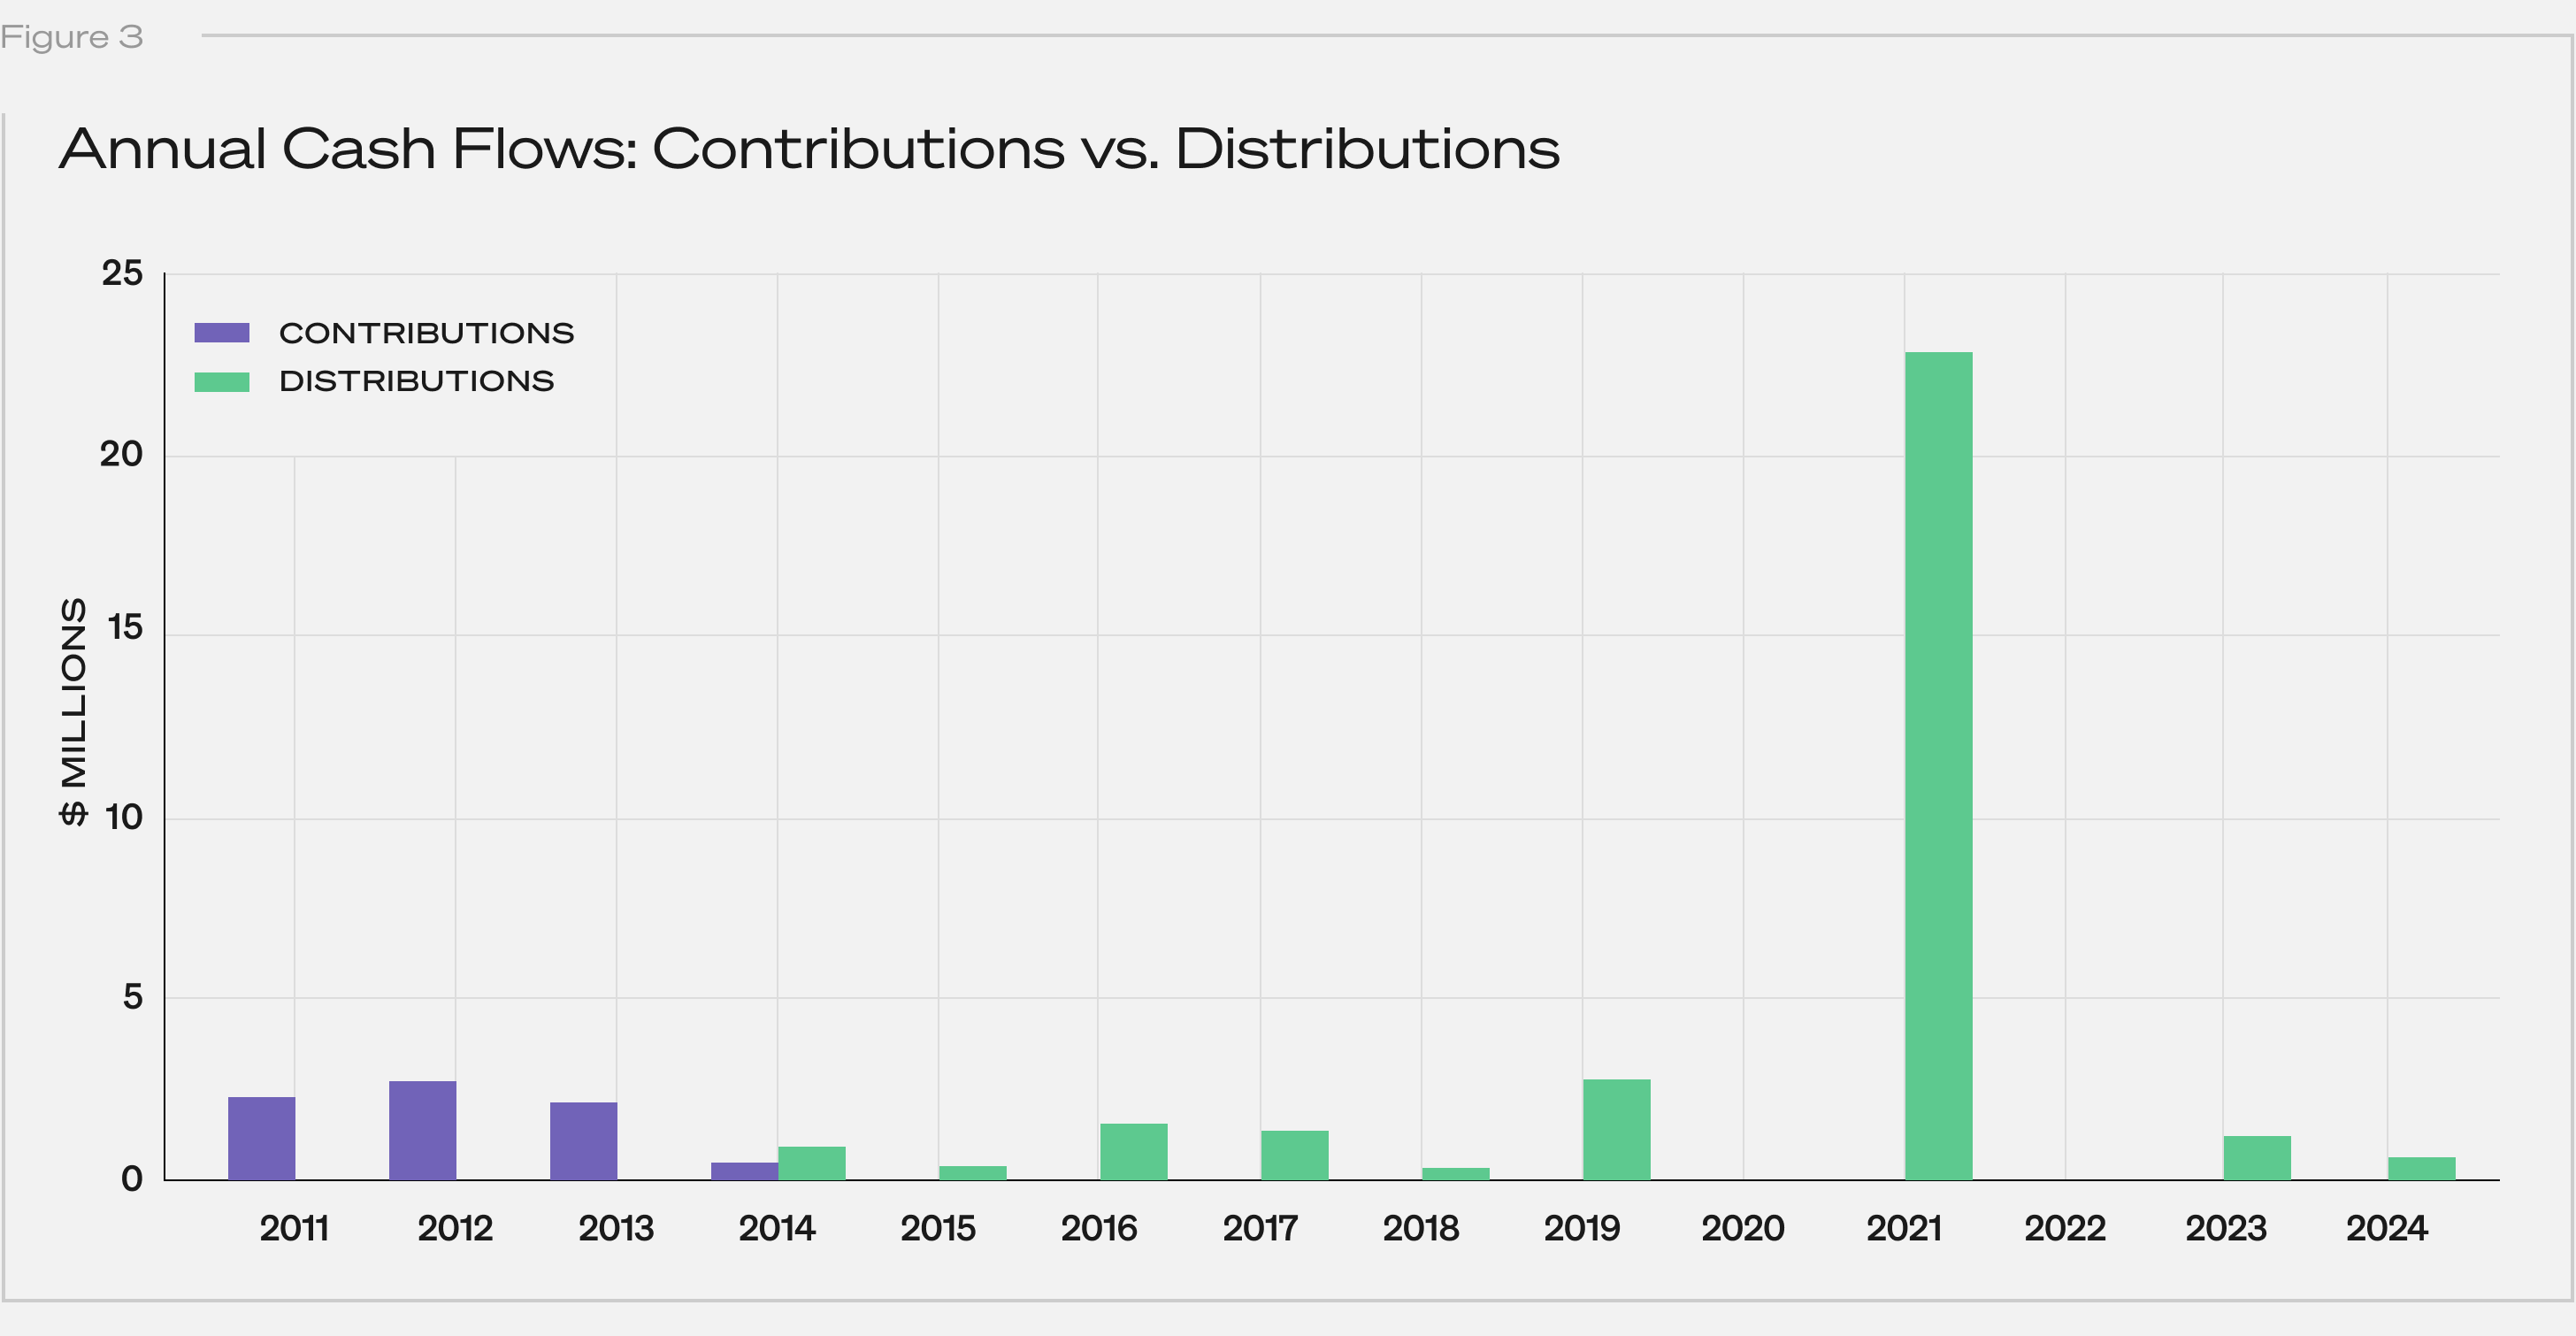
Contributions wrapped up by year 4, which is typical for early-stage funds. Distributions didn’t start until year 4 and peaked around year 10:
Returns metrics takeaways
- Strong overall performance: The fund achieved a 4.1x net DPI—solidly top-decile. For context, PitchBook pegs 3.0x as the 90th percentile for funds in the 2011 vintage.
- The patience premium: At year 10, DPI was 0.9x. There’s a lot of discussion right now around the lack of venture liquidity. 10 years in, this fund could’ve been a talking point. But then, in year 11, DPI jumped to 3.8x. Liquidity might be slow, but value can still be building.
- The IRR roller coaster: Net IRR hit 18% in year 6 (off paper gains), sagged in the middle years, then popped to 22% in year 11 after a major exit. IRR can be hurt by delays, even when final outcomes are strong.
- Some juice still left: Even after 14 years, the fund sits at 4.1x net DPI and 4.6x net TVPI. That means roughly 0.5x of upside is unrealized. That tees up the classic end‑of‑life question: seek to harvest the tail or ride it out?
- Shallow J-curve: Early markups lifted TVPI above 1x by Year 2, keeping LPs above water on paper even before distributions began.
Where did the DPI actually come from?
Returns were highly concentrated. Eight companies—Upstart, Lyft, Scopely, Blue Bottle Coffee, Maker Studios, Gumroad, Reddit, and Kickstarter—drove nearly all distributions.
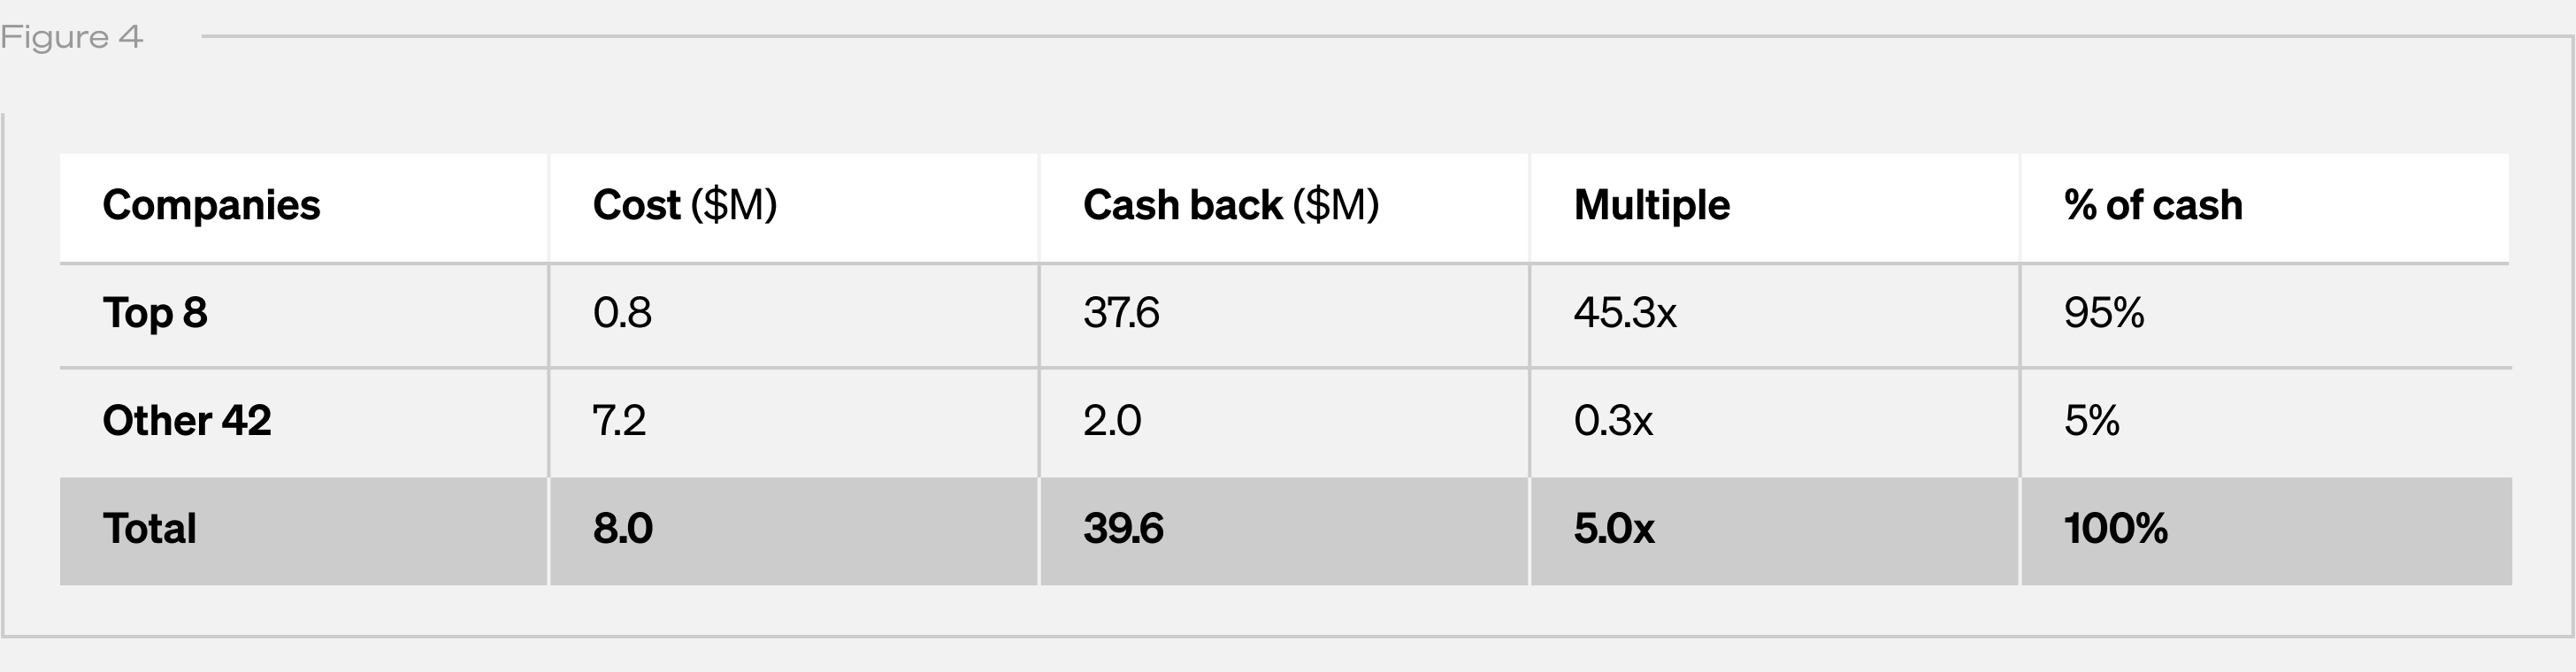
Note: “Cost” is cumulative capital actually invested. “Cash Back” is cumulative proceeds received by the fund from realization events, and excludes (i) any remaining unrealized value and (ii) fund-level fees and expenses. “Multiple” is the quotient of Cash Back divided by Cost.
Together, these accounted for just $0.8M of invested capital but returned $37.6M—an average multiple of 45x. The remaining 42 investments, representing $7.2M, returned only $2.0M (a 0.3x multiple).
Within those eight, outcomes varied widely: one company alone delivered 73% of all cash returned. Adding the next three brought the cumulative share past 90%. Multiples ranged from 1.4x to 115x—illustrating just how concentrated and variable even a “winning” subset can be.
Portfolio lessons
- Power law: Eight companies drove ~95% of all returns. One contributed 73% on its own.
- Capital efficiency: Less than $1M into the top eight generated $37.6M back.
- Check size ≠ upside: Some of the biggest winners were sub-$100K checks, while some larger bets in the tail went to zero. Limiting ticket size can cap downside without necessarily hampering fund performance.
- Winner variance: Even among the winners, multiples ranged from low single digits up to well over 100x, underscoring that not every winner needs to be a moonshot but a few big outliers can matter tremendously.
Conclusion
We believe the biggest risk in early-stage VC isn’t failure. It’s missing (or mis-sizing) the outlier. In Fund I, eight companies drove nearly all distributions. One check alone accounted for more than 70% of DPI. This is the power law at work.
Collaborative’s story now spans 15 years with four early funds in harvest mode. Three rank in PitchBook’s top quartile with two in the top decile by DPI. In each, a small number of companies drove the bulk of returns. Perhaps these will make for future posts.
Until then, I hope this serves as a reminder to take venture performance narratives based on unrealized funds with a grain of salt. Some trends are real and worth watching. But many of the loudest signals may fade or reverse as funds mature. Until they’re fully played out, their stories are still being written.