The Fed Isn’t Printing As Much Money As You Think
The risk of rising inflation over the next few years is probably the highest it’s been in decades. Inflation happens when too much money chases too few goods, and Covid-19 closed a lot of businesses and gave people an unprecedented amount of money. The stars align.
That out of the way, let me cool things down: The Fed is printing a lot of money, but not nearly as much as it looks.
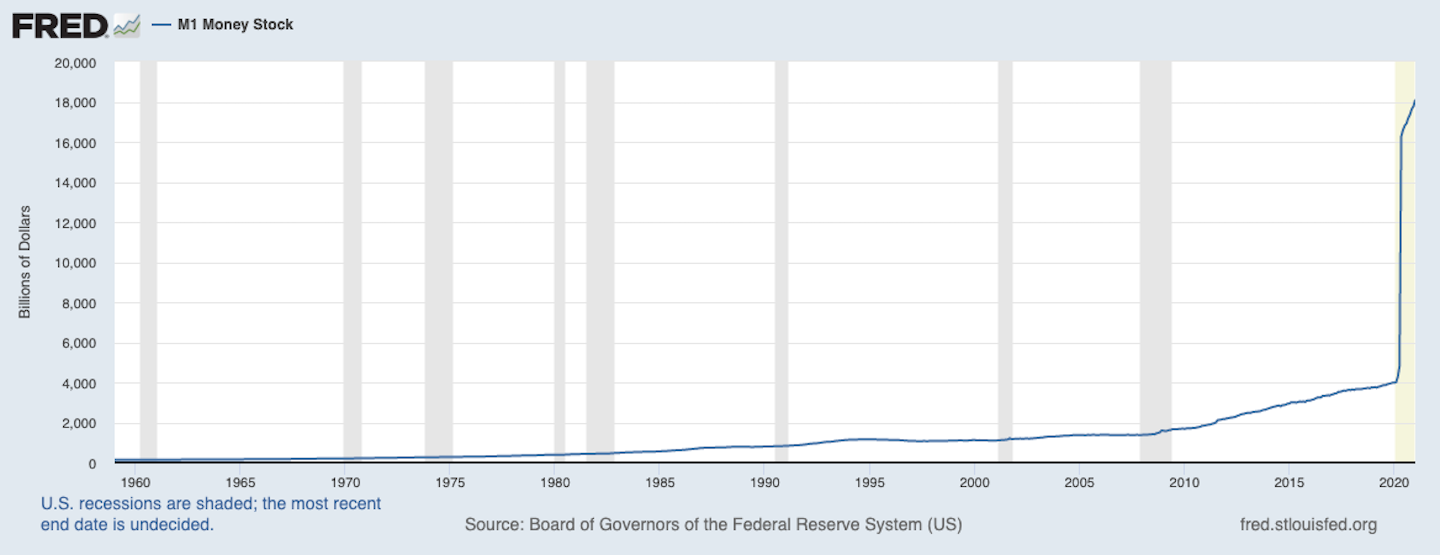
Here’s a chart I’ve seen shared everywhere – blogs, news articles, on social media, emailed to me by friends – that is scaring the dickens out of people:
It looks …. unbelievable.
Money supply has increased from $4 trillion a year ago to $18 trillion today.
A 350% increase!
That’s something you might see in a third-world country with hyperinflation.
But before you dump life savings into gold and build a bunker, here’s the punchline: The huge majority of the increase you’re seeing in this chart is not money printing or new money creation.
It’s an accounting rule change.
Here’s what happened.
The supply of money is measured a few different ways. M1, which this chart shows, measures money that’s readily available – mostly paper cash, coins, and checking accounts.
Another measure called M2 is a little broader. It includes money in savings accounts and retail money market accounts.
The difference between a checking and savings account is how often you can access your money. That might seem trivial but it explains most of what happened in this chart.
If you put money in a checking account, regulators make banks set aside a cushion as reserves in case they get into trouble. But if you put money into a savings account, regulators tell banks they don’t have to reserve anything. The catch is that it’s only considered a savings account if the consumer is allowed to make no more than six withdrawals per month.
It’s worked that way for years.
But then Covid hit, and regulators realized that having trillions of dollars in savings accounts with limited withdrawals was a burden as 22 million people lost their jobs.
So last April the Fed changed the rules and eliminated the six-withdrawal limit on savings accounts. It wrote:
The interim final rule allows depository institutions immediately to suspend enforcement of the six transfer limit and to allow their customers to make an unlimited number of convenient transfers and withdrawals from their savings deposits at a time when financial events associated with the coronavirus pandemic have made such access more urgent.
It was an obvious and nearly risk-free way to help people. Just let them have easier access to their savings.
But it changed the relationship between M1 and M2.
Savings accounts are measured in M2 and left out of M1. But once the six-withdrawal rule was removed, every savings account suddenly became, in the eyes of regulators and people who make these charts, a checking account.
So M1 exploded higher. Not because the Fed printed a bunch of money, but because trillions of dollars in savings accounts were reclassified as checking accounts.
How much money are we talking about? The Fed explained in a footnote that I’m sure no more than seven people read:
Recognizing savings deposits as a transaction account as of May 2020 will cause a series break in the M1 monetary aggregate. Beginning with the May 2020 observation, M1 will increase by the size of the industry total of savings deposits, which amounted to approximately $11.2 trillion.
Of the $14 trillion increase in M1, $11.2 trillion (80%) came from an accounting rule change that shifted money from savings accounts to checking accounts.
That’s why M2, which is more comprehensive than M1, has increased by $11 trillion less than M1 over the last year.
Two things stick out here:
What else are we missing? What other data points look straightforward but, when dug into, reveal themselves to be more complicated than we imagined? It has to be dozens, hundreds, thousands.
Covid-19 has broken the relationships and long-standing correlations across all kinds of economic variables. Forecasting is always hard, but it’s harder now.